Costs and Profits
To best understand production costs, it would be helpful if you imagined yourself as an owner of a company. It is up to you to make decisions on how much to produce, to figure out the costs for running your business, and to look to possible expansion. The information discussed below should help in making smart business decisions.
 Whether your company is small or a multinational firm, understanding costs is essential to the success of the firm. A firm is an organization that produces goods or services. The terms firm, company, and business may be used interchangeably. Imagine you are the owner of a company. One of your primary motivations is to make a profit ( profit motive). In order to make a profit, you need to keep an eye on costs. The goal of a business owner is profit maximization. There are two different costs in production. They are:
Explicit Costs– These represent payments to non-owners of a firm for their resources. Examples are such things as wages, rent, materials, and utilities.
Implicit Costs– These are the opportunity costs of resources owned by a firm. An example would be if you started your own company you give up a salary working for someone else. Also, if you start your own business, and use your own money, then another implicit cost would be the interest your money could have made as an investment.
Normally we think of profit as representing total revenue minus total cost. If only explicit monetary costs are considered, we get accounting profit. But for economists this isn’t good enough. We need to figure in opportunity costs. That is why economists define economic profit as: total revenue – (explicit + implicit costs). When we look at profits, we assume that firms want to maximize profits, that is, determine a level of production that will make profits as high as possible.
Short Run Versus Long Run Production Costs
Most successful businesses have one eye on the present, and the other on the future. In other words, they are focused on the health of the firm in the short run, but also concerned with how the business will be doing in the long run. The information below should help you to understand these concepts.
 There is no way for economists to precisely define with respect to a specific number of days, when a company is operating in the short run or long run. But there are some factors that help determine where a firm is at. Each business or firm has inputs or resources used in the production of a good or service. There are two types of inputs. The first, a fixed input, is a resource for which the quantity cannot change during a period of time. Inputs are considered “fixed” because of earlier decisions made by the business. Examples of fixed inputs would be the physical building a business is located in and heavy and expensive equipment. Let’s look at the typical automobile plant. The assembly line is considered fixed because the total amount of money spent in buying the assembly line does not vary, whether it produces 10 or 100 cars per day. The second type of input is called a variable input. A variable input is a resource for which the quantity can change during a period of time. Examples would be workers or raw materials.
This finally leads us to whether a firm is operating in the short run or long run. A firm is operating in the short run if there is at least one fixed input. For example, many firms have as a fixed input the size of the plant. It would probably take a year or longer to find a new building or to expand. A firm can increase output by hiring more workers (variable input) while the size of the firm’s plant (fixed input) remains unchanged. A firm is in the long run when it experiences a period of time so long that all inputs are variable. While owners of a farm or a restaurant make decisions in the short run to ensure their business survives, they are also planning for longer periods of time. Over longer periods of time, business owners can make decisions on expanding or building new facilities. Businesses that have been around for decades, such as IBM or General Electric, now operate in the long run. Large multinational corporations such as these, with their huge amount of financial capital, can easily relocated to other countries in a short amount of time. For them, physical buildings are no longer fixed inputs.
If we look at a restaurant, we can see how the short run and long run work. On a busy night, the owner of a restaurant might move some workers temporarily from cooking to cleaning up tables. In the long run, the owner might want to build a larger restaurant.
Now that we have talked about inputs, we can now look at the transformation of inputs to outputs. This involves discussing another production concept called marginal product. Marginal product refers to the change in total output produced by adding one unit of variable input, with all other inputs being held constant. The input most frequently associated with marginal product is labor.
An economic law called the Law of Diminishing Returns helps to demonstrate the concept of marginal product. The law of diminishing marginal returns states that beyond some point the marginal product decreases as additional units of a variable factor are added to a fixed factor. Imagine your business. You are wondering how many people to employ. As you add each new worker there are less tasks for them to work on. Soon you have workers standing around with nothing to do. You want to stop hiring workers when diminishing returns occur, in other words, when productivity declines. Look at the table below for an illustration of the Law of Diminishing Returns.
Number of Workers Total Output
| 1 | 10 |
| 2 | 25 |
| 3 | 42 |
| 4 | 48 |
| 5 | 55 |
If you are the owner of the business above, how many employees should you have working for you? If you said 3, you are correct. Starting with the fourth worker, there are diminishing returns. How was this determined? Simply by dividing the total output by the number of workers (input). So 42/3 equals 14. 48/4 equals 12. You can see how 12 is a decrease from 14. This calculation is also referred to as average product. This is seen in the last column in the table below.

As a business continues to add inputs (for example labor), they will reach a stage where not only will they not experience a positive return for each additional unit of input, but they will experience a decrease in overall output. This is referred to as negative returns. This is seen in the color red in the graph below.

Total product, marginal product, and average product can all be graphed. Their shapes are determined from by how in the beginning there are increasing returns, and then later those returns begin to decrease. Their graphs are below. Notice how for total product (this is the second column, and represents total units produced and is the top graph with a green line) the curve bends towards the end as more labor is added but the total number of units produced begins to decrease (demonstrated by yellow color). Marginal product is the third column and is seen with the blue curve in the bottom graph. Notice how it increases until it reaches a peak of 6, then begins to decline. This explains the shape of the blue curve. The same holds true for the fourth column which measures average product (reddish-brown curve in bottom graph) which is calculated by dividing the total product by the number of units of labor. Average product begins to see diminishing returns with the introduction of the fifth worker.

The concept of marginal returns is useful to business owners because it tells the owner the optimal time to stop adding more inputs so that you get the best returns for the time and resources that were invested. The example below(from the website personal excellence) applies to a restaurant business:
Say you run a restaurant but you only have one chef. You hire more chefs, which results in more meals prepared… initially. Eventually, you reach a point where the increase in total meals prepared per new chef decreases, even though the new chefs are as skilled as your current ones. Meaning…
- 1 chef → 50 meals a day
- 2 chefs → 100 meals a day (total). This is a marginal increase of 50 meals (100-50) after hiring a 2nd chef.
- 3 chefs → 150 meals a day (total). This is a marginal increase of 50 meals (150-100) after hiring a 3rd chef.
- 4 chefs → 180 meals a day (total). This is a marginal increase of 30 meals (180-150) after hiring a 4th chef. As it’s lesser than your previous marginal increase, you’ve hit diminishing returns!
* Assume unlimited orders coming in
Why does this happen? One possible reason is that by having so many chefs in a fixed kitchen space, you create problems originally not there. For example, chefs getting in each other’s way while cooking, chefs having to compete for use of kitchen tools (pots and pans), and so on.
Continuing to hire new chefs, despite diminishing returns, will eventually lead you to negative returns:
- 5 chefs → 200 meals a day (total). This is a marginal increase of 20 meals (200-180) after hiring a 5th chef
- 6 chefs → 180 meals a day (total). This is a marginal decrease of 20 meals (180-200) after hiring a 6th chef, despite paying more money to hire a 6th person!!
The negative returns is because the earlier problems causing diminishing returns are now aggravated. Firstly, there are not enough stoves for every chef to do their cooking. Secondly, the chefs, having even less space and resources per person, become frustrated and get into arguments, which prevents them from getting work done. Thirdly, some chefs may be slower in their meal preparation due to the lack of space and negative work climate.
By hiring so many chefs to the point of negative returns, you have negatively affected the productivity dynamics of the system, hence leading to a decreasing output.
Profit Maximization
As stated earlier in this unit, business owners are in business to make a profit. They would like to enjoy the highest level of profits possible. This makes business owners seek out the profit maximization level. The starting point is recognizing that profit equals total revenue (TR) minus total cost (TC). The profit maximization level is where the difference between total revenue and total costs is at its greatest. Businesspeople know what their current position is (revenue and costs) and they can estimate TR and TC for a higher (or lower) level of production. By actually changing output levels, they learn by experience what their demand and cost curves look like. In the process, they discover what happens to profit as they change output levels. Through this discovery process, businesspeople seek to find the output level that maximizes profit.
Figuring out the Cost of Operating Your Business
Let’s suppose you decide to open up a small store front business. How do you figure out how much to charge for your product? The terms below should help you understand the various costs involved.
Total Fixed Costs. These are costs that do not vary as output varies and must be paid. Examples are rent, interest on loans, and insurance.
Total Variable Costs. These are costs that vary as output varies. Examples include wages, electricity, and raw materials.
To figure out the total costs of producing your product you need to add your total fixed costs to the total variable costs. ( TC = TFC + TVC )
Now let’s say you want to figure out how much of the cost of your product is represented by fixed costs. To figure average fixed costs, you want to divide your total fixed costs by the quantity of product sold.
AFC = TFC / Q
The same can be done for figuring out your average variable cost.
AVC = TVC / Q
To figure out your average total cost you divide your total cost by the quantity sold. Average total cost is sometimes referred to per unit cost.
ATC = TC / Q
The table below shows the various short run costs for a firm producing a product. The firm faces labor costs of $50 per unit, which is the only variable cost. It has fixed costs of $100. The columns below show the relationship between labor and output. There will be some rounding off of numbers and averages do not exist for zero units of output since one cannot divide by zero.
| Labor | Output | AP | MP | TVC | TFC | TC | AVC | AFC | ATC |
| 0 | 0 | 0 | 100 | ||||||
| 1 | 5 | 5 | 5 | 50 | 100 | 150 | 10 | 20 | 30 |
| 2 | 14 | 7 | 9 | 100 | 100 | 200 | 7.14 | 7.14 | 14.28 |
| 3 | 27 | 9 | 13 | 150 | 100 | 250 | 5.55 | 3.7 | 9.25 |
| 4 | 40 | 10 | 13 | 200 | 100 | 300 | 5 | 2.5 | 7.5 |
| 5 | 50 | 10 | 10 | 250 | 100 | 350 | 5 | 2 | 7 |
| 6 | 54 | 9 | 4 | 300 | 100 | 400 | 5.55 | 1.85 | 7.4 |
| 7 | 56 | 8 | 2 | 350 | 100 | 450 | 6.25 | 1.79 | 8.04 |
Production Choices and Costs in the Long Run
Remember, in the long run, a firm may change the quantities of all its factors of production. How does a firm decide on what mix of capital, labor and other factors to use? The long run average cost curve is a tool used by those in business to make such a determination.
Long Run Average Cost Curve– This curve traces the lowest cost per unit at which a firm can produce any level of output after the firm builds any desired plant size. It is a company’s planning curve. The plant size in the long run is determined by the expected level of production. The curve itself shows the minimum or lowest average total cost at which a firm can produce any given level of output in the long run (when all inputs are variable).

Click here to see additional practice problems for the topics in this unit.
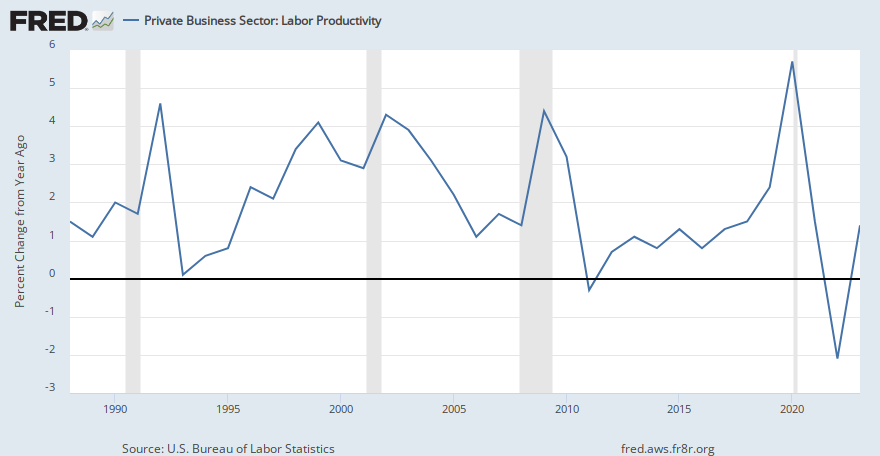
Labor Productivity
No matter the business model, owners of a business are interested in how productive their employees are. Labor productivity is a measure of how much a typical worker can produce (output) per hour of work. Firms are in business to maximize profits. Each time an employee is added, a business adds to its output and its costs. As a business continues to hire labor, eventually the costs of additional units of labor exceed the extra output. This was discussed above in describing the law of diminishing marginal returns.
There are three factors that influence labor productivity. The first is physical capital. By applying physical capital to the work we do in our farms, factories, and offices, we can increase productivity. No matter how educated workers are they still need physical capital such as computers, machinery, and other equipment to produce goods and services. The second factor is human capital, which refers to the knowledge and skills that people possess. The average student in graduate school will possess more human capital than the average student in high school. This would mean then that the average graduate student would be more productive than the average high school student. The third factor is technology. A farmer using a plow may be able to cultivate two acres of land in a day. A farmer using a modern tractor, might be able to cultivate two thousand acres in a day, making the farmer with a tractor more productive.
Labor productivity can be measured. From the 1970’s to the mid 1990’s, labor productivity in the United States and many other countries declined. Since the mid 1990’s, there has been an increase in productivity. Many economists attribute this to advances in technology, particularly computers and the internet. Labor productivity is an important measure of economic performance. As a tool, it helps determine the standard of living in a country. Not only does an increase in productivity help improve individual lives, but it helps the government to pay off the debt, finance social security, invest in education and health care, lower taxes, etc… If productivity is declining, it is most likely that wages would also show a decrease.
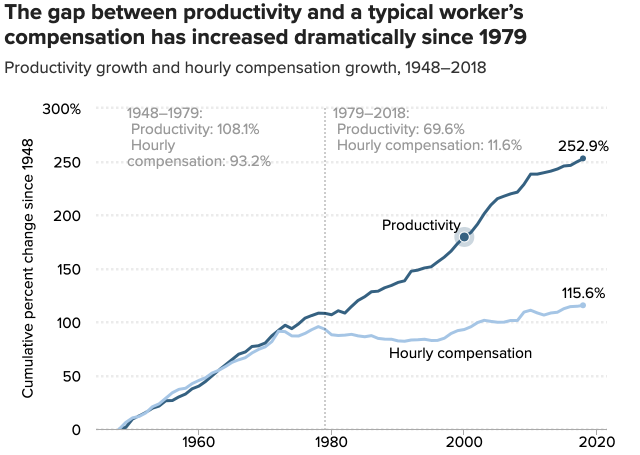
During the 1973 to 2011 period, labor productivity rose 80.4 percent but real median hourly wage increased 4.0 percent, and the real median hourly compensation (including all wages and benefits) increased just 10.7 percent. These trends are shown in the table below. If the real median hourly compensation had grown at the same rate as labor productivity over the period, it would have been $32.61 in 2011 (2011 dollars), considerably more than the actual $20.01 (2011 dollars). Consequently, the conventional notion that increased productivity is the mechanism by which living standards increases are produced must be revised to this: Productivity growth establishes the potential for living standards improvements and economic policy must work to reconnect pay and productivity. Growing inequality of compensation and the erosion of labor’s income share are the key overall drivers of the wedge between productivity and median compensation, accounting for two-thirds of the wedge since 1973 and about 85 percent of the wedge since 2000. These factors, in turn, reflect the various ways that the typical worker has lost bargaining power in the economy over the last three decades: excessive unemployment, eroded labor market institutions such as the minimum wage and unions, globalization, deregulation of industries, privatization, and the rising power of finance. 1

1. How the Bureau of Labor Measures Productivity
2. When Workers Acquire Human Capital, Who Owns It?
An Alternative View of Productivity
Productivity gains are generally reported in the news and discussed in economic circles as always being a positive because it raises national income and allows businesses to pay higher wages to workers? But do they always pay higher wages? The US economy has experienced productivity gains the past few decades, but wages have not kept pace with the increases in productivity. Who then is benefiting? Some critics suggest the benefits have gone to management. This is one of the factors that explains the increase in the wage gap between workers and CEO’s. Another problem concerning productivity and workers is that increases in productivity generally translate into lost jobs and an increase in unemployment. Everyone cheers if manufacturing 100 cars took 500 workers last year and only 490 this year. Productivity increased, which the media focus on, but no one talks about the ten people who are now out of work. A productivity gain, taken by itself, means a loss of jobs. Think of it this way. If each year productivity increases 2.5%, over the course of decade that would mean the loss of 25% of our jobs. Under such a scenario, you can see why politicians and economists emphasize growth as a solution. Do some in society benefit more than others when there is an increase in productivity? According to a Forbes Magazine article in 2009, the Forbes 500 list of top companies slashed 821,000 jobs while seeing profits go up by $391 billion, an increase of 335% from the previous year.
Classical economics has long emphasized the relationship between income and productivity through the concept of marginal productivity theory. This theory tries to explain income differences between workers. This theory suggests that human capital (skills) have made skilled workers more productive which has allowed them to make more money. Any differences in income then can be attributed to productivity differences.
However, many economists today are questioning the basic premise behind marginal productivity theory. The main reason is that we cannot objectively compare the productivity of two workers unless they produce the same thing. We can’t compare the productivity of people who produce different things. To measure productivity objectively, we can only compare workers doing the same task. Marginal product theory claims that productivity differences universally explain income differences. But we can never actually test the theory, because productivity differences cannot be universally measured. New research suggests that differences in workers’ productivity are tiny compared to differences in income. So it’s inconceivable that productivity differences can explain income inequality. This will be an important point to remember when we get to unit 9 and talk about income inequality.
1. The Gap Between Growing Productivity and Workers Wages
When measuring productivity, many people focus on “average” labor productivity which includes all workers in the economy. But some workers are more productive than others. Why is it that some workers such as teachers, doctors, baseball players and government workers see their salaries go up even though they are not more productive? This is because of an economic concept called the, “cost disease of the personal services“. This long phrase describes how some jobs in our economy have seen real wages rise because of increased productivity ( manufacturing, telecommunications, automobiles, computers), usually through the savings of labor costs by using more and better equipment and technology. This is not true for teachers, doctors, and government workers. It takes the modern doctor the same amount of time to give a patient a physical as it did a doctor 50 years ago. We could try to make a teacher more productive by giving him/her a large increase in the number of students they teach, but most students and parents would consider this a decrease in the quality of education they are receiving. In the short run, jobs that are productive (computer, telecommunications) and hence pay more, attract workers to the field. But in the long run, the pay for someone in the computer or telecommunication industry must equalize with that of the teacher or government worker, or else no one would want to become a teacher, doctor, government employee, etc… To sum up, the cost disease of the personal services refers to service jobs that require personal contact and that see little or no productivity gains, tend to see their wages rise to attract workers who might otherwise seek employment in fields with high productivity and rising wages.
Different Scales of Production
Most businesses start small and mature into larger firms. How does a firm know what decisions to make to grow? How does it know when to expand and build a new facility? The information below should provide a better understanding of economies of scale.
 As was discussed earlier, changing the size of a firm can change its long-run average cost, or the cost per unit of output. Economies of scale are present when as a firm increases output, and the cost per unit declines. Why? Because businesses are able to take advantage of a couple of factors. The first is division of labor. The second is specialization. These two combined help make modern factories productive. The third is the efficient use of capital or new machinery. A new machine might be able to produce more items in a day that the one it replaced, thus bringing down the cost per unit. Companies such as Wal-Mart, experience economies of scale through low inventory, efficient management, and huge volume discounts. Economies of scale affect operation in many modern industries. Where they exist, they give larger firms cost advantages over smaller ones. A firm can experience these cost advantages if they can expand its production in the long run.
What questions should a business ask to see if it can take advantage of economies of scale? The four questions a company should ask are listed below.
1) Would a larger factory allow a more productive layout of machines?
2) Can larger-scale machines be found that produce the output more cheaply than current machines?
3) Can jobs be broken down into a narrower range of tasks so that greater specialization of labor can be achieved?
4) Will suppliers give discounts for the larger orders that will be placed in the future?
A firm can also experience diseconomies of scale. This occurs when the cost per unit increases as a firm increases in size. Why? Mostly because it becomes a large bureaucracy. Things get lost in the chain of command. Management becomes multi-layered, with ideas being lost. Finally, there is a lack of communication between members of the firm because of its large size. Diseconomies of scale cause larger organizations to produce goods and services at increased costs.
Economies of scale have a huge impact on the size of firms that will operate in a market. The various types of markets will be discussed in the next unit.
Types of Businesses
There are different types of businesses that an entrepreneur will want to consider before beginning production. Below is a short description of the types of businesses.
 1. Sole Proprietorship. Sole proprietorships are businesses owned by individuals. They are usually small businesses, with respect to sales and employment. There isn’t a legal or financial distinction between the business and the business owner, which means that you as the business owner are fully accountable for all of the profits, liabilities and legal issues that your business may encounter. Restaurants, barbershops, gas stations, and family farms are examples of sole proprietorships. The advantages to a sole proprietorship are: 1) you can take pride in what you do, 2) you are your own boss and have complete control over all decisions, and 3) all the profits belong to the owner. There are also disadvantages. The biggest being that you are liable for all debts. Because there is no legal separation between the owner and the business, the owner is personally liable for all debts and obligations. A second disadvantage is if a misfortune comes to the owner, the business suffers. This means that service could decline or the business closes. A third disadvantage is that banks are also hesitant to lend to a sole proprietorship because of a perceived lack of credibility when it comes to repayment if the business fails.
 2. Partnerships. Partnerships are two or more people owning a business. Business responsibilities, including financial and legal, fall upon each business owner. Depending on how the ownership is divided (either equally or not), there are different types of partnerships to explore from a legal standpoint. Examples would be a law firm or a small business, such as an auto repair store. There are advantages and disadvantages of a partnership. The advantages are: 1) two heads are better than one, where one person may be skilled in sales, while another person skilled in accounting, 2) easy and inexpensive to form, and 3) owners are able to raise more capital. The disadvantages are that owners are liable for all debts, 2) the partnership must be dissolved if there is a disagreement, a partner leaves, or dies and 3) profits need to be shared amongst all members.
 3. Corporations. A corporation is an independent legal entity owned by shareholders and is seen by the courts as a legal person. It is the corporation itself, not the shareholders that own it, that is held legally liable for the actions and debts the business incurs. Corporations are businesses that are publicly owned. A corporation is formed under the laws of the state in which it is registered. Typically articles of incorporation need to filed with a state’s Secretary of State office. Some states require corporations to establish directors and issue stock certificates to initial shareholders in the registration process. Examples would be General Motors and Microsoft. There are advantages and disadvantages for corporations. Advantages include: 1) corporations can go on forever- they do not have to be dissolved when someone dies, 2) they have limited liability, where each owners liability is limited to the money invested in the business and stockholders can’t be sued, and 3) corporations can raise a large amount of money through the sale of stock. There are also disadvantages. The first is that there is a great deal of legal paperwork in creating a charter. Second, there is double taxation because corporations are taxed twice – first, when the company makes a profit, and again when dividends are paid to shareholders, and lastly, there is extensive regulation.
One of the main benefits corporations have is to be able to raise money through the sale of stock. They accomplish this by being listed on a stock exchange. Corporations must give up ownership to the public when their stock is offered for sale. To learn more about how the stock market works, click on the link below.
1. Jon Stewart of the Daily Show Explains the Benefits for Individuals Who Incorporate Themselves
4. Limited Liability Company. This is better known as an LLC. An LLC is a newer type of business that is a blend between a sole proprietorship and a corporation. Instead of shareholders, with LLCs, owners are referred to as members. No matter how many members a particular LLC has, there must be a managing member who takes care of the daily business operations. The main difference between an LLC and a corporation is that LLCs aren’t taxed as its own business entity. Instead, all profits and losses are moved from the business to the LLC members, who then, instead of having to report business finances on a corporate return, can report profits and losses on a personal federal tax return. An advantage to pursuing an LLC is that members aren’t personally liable for business decisions or actions of the company in question, and there’s far less paperwork involved in creating an LLC as compared to a corporation.
5. Non-profit organization. This is a business organization that’s intended to promote educational or charitable purposes. The “non-profit” aspect comes into play in that any money earned by the company must be kept by the organization to pay for its expense, programs, etc. There are several types of nonprofits available, many of which can receive “tax exempt” status. This process requires filing paperwork, including an application, with the government for them to recognize the business as a nonprofit organization.
6. Cooperative. A cooperative is a business that’s fully owned and operated for the benefit of the members of the organization that use its services. In other words, whatever is earned by the cooperative is then shelled out among the members themselves, and aren’t required to be paid out to any external stakeholders, etc. Unlike other types of businesses which have shareholders, cooperatives sell shares to cooperative “members,” who then have a say in the operations and direction of the cooperative itself. The main difference in the process of becoming a cooperative, as opposed to the other types of businesses listed, is that your organization must create bylaws, have a membership application and have a board of directors with a charter member meeting. Some cooperatives, like credit unions and rural utility cooperatives, are exempt from federal and state taxes due to the nature of their operations. Some of the advantages are that 1) there may be a variety of government funded grant programs to get a cooperative started, 2) members can join or leave without the dissolution of the business, 3) democratic organization, and possible reduced costs and improved products or services.
Percentages of Firms by Legal Form
The vast majority of businesses (73%) are sole proprietorships. Corporations make up 21 % and partnerships 6%.2
Percentage of Revenues by Legal Form
Although sole proprietorships far outnumber corporations, corporations receive the largest percentage ( 91%) of revenues earned by U.S. firms. Proprietorships receive 6%, and partnerships 3%.3
What is the Impact of Corporations on Small Businesses?
After having read the information above, it might appear that corporations have some advantages over the other two types of businesses. And it would be difficult to argue that they do not. Small businesses don’t have the time or resources to lobby the various levels and branches of government like corporations can. This means that large corporations have the resources to ensure that regulations and tax issues come out favorable for them. This lobbying effort comes many times at the expense of the small business owner. For example, most of the farm subsidies do not go to small family farmers, but rather to large corporate farms.
1. Corporations Among the Largest Economic Entities
3. Reclaimdemocracy.org (Restoring Citizen Authority over Corporations)
4. Largest Corporations Wealthier Than Most Countries
5. The World is a Corporation Speech from the movie “Network”
7. How “New” Corporations are Attempting Rebranding Even Though They Are Still Focused on Profits
On the Power and Role of Corporations in the World
Corporations have neither bodies to be punished, nor souls to be condemned; they therefore do as they like. —Edward Thurlow, 1st Baron Thurlow, Lord Chancellor of Great Britain 1778et seq
This long historical shift away from free markets and toward corporate power has left such a clear trail of evidence it’s a wonder it’s not self evident. How else can we interpret the corporatization of war and the military and the billions in direct and indirect subsidies to corporations? Government shelters banks, guaranteeing loans and mortgages while bailing out stupid investors. [5] Wealth is redistributed to the top though massive tax breaks and cuts to social programs. Legally enforced starvation wages push workers to public assistance ultimately subsidizing their bosses. Tax codes encourage the rich to shelter trillions in tax havens while the unrepresented masses make up the difference. Federal programs like “quantitative easing” pumps free money into the financial system. The risk and losses from environmental destruction are for us to reckon with while the rule of law has been suspended for corporate criminals of all kinds. Major economic decisions have largely migrated from national governments to even more dictatorial global bodies. The IMF, WTO and World Bank do the bidding of the largest corporations that are the foundation of the US imperial alliance. – Richard Moser in Counterpunch
Bibliography
Parkin, Michael 2000 Economics (5th Edition) New York: Addison- Wesley
Slavin, Stephen L. 1999 Economics (5th Edition) New York: Irwin McGraw-Hill
Taylor, John B.
2001 Economics. Boston: Houghton Mifflin Company
Tregarthen, Timothy.
2000 Economics (2nd Edition) New York: Worth Publishers
Tucker, Irvin B. 1995 Survey of Economics New York: West Publishing Company
1 Lawrence Mitchell: Understanding the Wedge Between Productivity and Median Compensation Growth
2 Number of Tax Returns by Type of Business, 1990 – 2008
3 Ibid
Copyright ©2007, 2014 Glenn Hoffarth All Rights Reserved

Leave a comment